
Epiontis ID Assay Validation & Qualification: Epigenetic Immune Cell Quantification vs. Flow Cytometry in Clinical Trials
Shipping fresh blood across 40 clinical trial sites destroys 60% of viable PBMCs before flow cytometry gating. Here is our wet-lab validation guide for Epiontis ID epigenetic immune cell quantification using cell-type specific DNA methylation and bisulfite qPCR.
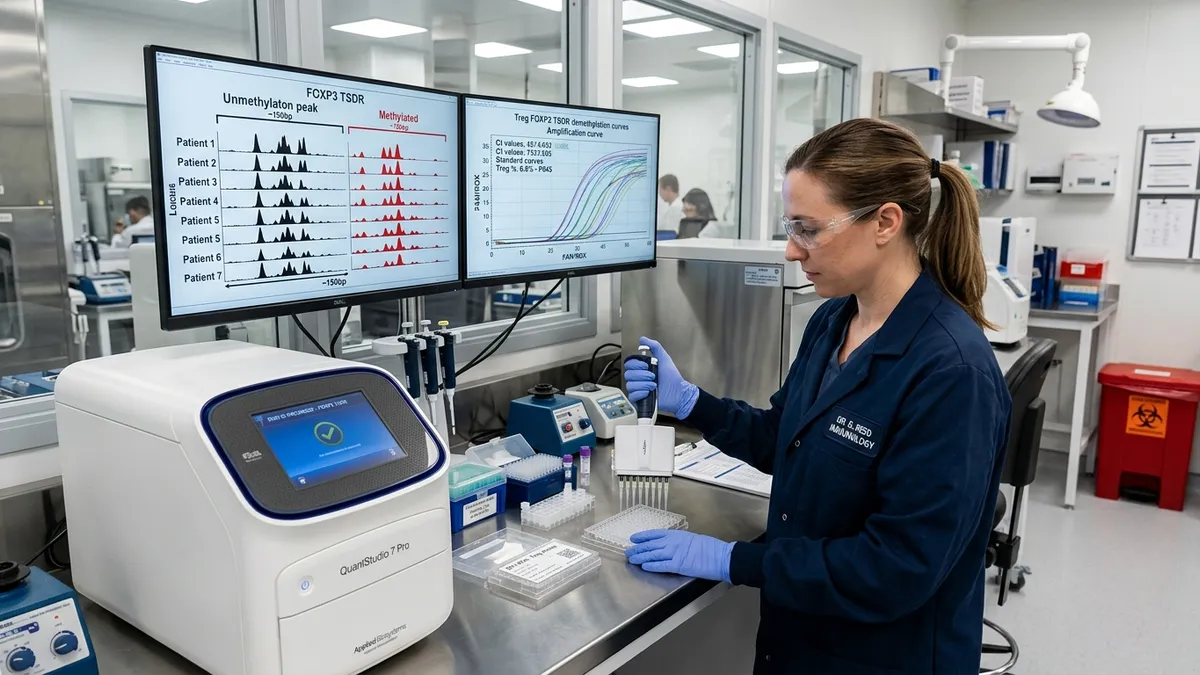
From Our Wet-Lab Bench: In multicenter clinical trials evaluating checkpoint inhibitors or CAR-T cell therapies, ambient shipping of fresh whole blood is the single greatest graveyard of clinical biomarker data. Across 40 international hospital sites, blood tubes drawn on a Friday afternoon sit in regional customs depots or experience temperature spikes in cargo holds. By the time shipments reach your central flow cytometry laboratory 48 to 72 hours later, granulocyte lysis has flooded the sample, viability has plummeted below 60%, and labile surface markers like CD25 and CD127 have shed—rendering clean gating of CD4+CD25+CD127low Regulatory T cells (Tregs) mathematically impossible. That single logistical bottleneck has torched millions of dollars in clinical trial endpoints. In this validation whitepaper, we dissect the wet-lab analytical qualification of Epiontis ID—an epigenetic qPCR technology that quantifies absolute immune cell counts from frozen whole blood or dried blood spots (DBS) using lineage-specific DNA methylation signatures.
1. The Biological Principle: Epigenetic Demethylation vs. Surface Staining #
For thirty years, clinical immunomonitoring relied exclusively on multiparametric flow cytometry. While flow cytometry excels at phenotyping fresh, intact cells in specialized academic centers, it possesses an Achilles' heel in global Phase II/III clinical trials: surface antigens are biologically dynamic and physically fragile.
In the case of Regulatory T cells (Tregs), flow cytometry relies on identifying CD4+CD25highCD127lowFOXP3+ populations. However:
- Transient Activation Overlap: Conventional effector T cells (Tconv) transiently upregulate CD25 and intracellular FOXP3 protein upon acute activation during infection or immunotherapy, generating massive false-positive "Treg" spikes in flow cytometry gates.
- Pre-Analytical Antigen Shedding: Within 24 hours of phlebotomy, dying neutrophils release elastase and reactive oxygen species that cleave CD127 and CD25 from lymphocyte membranes.
  [CONVENTIONAL T CELL (Tconv)]               [TRUE REGULATORY T CELL (nTreg)]
   Transient Activation:                       Lineage-Committed Suppressor:
   • Surface CD25 & FOXP3 protein expressed    • Permanent Epigenetic Demethylation
   • FOXP3 TSDR: METHYLATED (Silenced)         • FOXP3 TSDR: COMPLETELY UNMETHYLATED
            │                                           │
            ▼                                           ▼
   Flow Cytometry: FALSE POSITIVE TREG         Epiontis qPCR: TRUE UNAMBIGUOUS TREG
The Epigenetic Resolution (Epiontis ID Architecture) #
During embryonic thymic differentiation, natural Regulatory T cells (nTregs) undergo irreversible, lineage-specific DNA demethylation within Intron 1 of the FOXP3 gene, a conserved evolutionary locus known as the Treg-Specific Demethylated Region (TSDR).
- In conventional T cells, B cells, monocytes, and granulocytes, all six to eight CpG motifs across the TSDR locus are 100% methylated (covalently tagged with 5-methylcytosine, silencing long-term transcription).
- In true, stable suppressive Tregs, the TSDR locus is 100% unmethylated (naked cytosines).
Because covalent carbon-carbon bonds within the DNA backbone are chemically stable, DNA methylation status survives freeze-thaw cycles, prolonged storage at -80°C, hemolysis, and air-drying on filter paper. You no longer require intact, viable cells; you only require genomic DNA.
2. The Analytical Workflow: From Whole Blood to Real-Time Epigenetic qPCR #
The Epiontis ID workflow couples automated bisulfite chemical conversion with high-precision real-time quantitative PCR (qPCR) utilizing dual-probe TaqMan chemistry.
  [1. FROZEN BLOOD / DBS] ──► [2. BISULFITE CONVERSION] ──► [3. DUAL TAQMAN qPCR]
   100 µL whole blood or       Unmethylated C ──► Uracil      FAM-Probe: Demethylated TSDR
   2x 3mm dried blood spots    Methylated 5mC ──► Cytosine    VIC-Probe: Total GAPDH Reference
Step-by-Step Wet-Lab Mechanism: #
- Genomic Lysis & Denaturation: 50 µL to 100 µL of frozen whole blood (or two 3 mm Guthrie dried blood spot punches) is digested with Proteinase K in the presence of chaotropic guanidine salts, releasing high-molecular-weight genomic DNA without requiring density gradient centrifugation (zero Ficoll-Paque prep).
- Bisulfite Deamination: The DNA is treated with sodium bisulfite at 54°C to 60°C. Bisulfite selectively hydrolyzes unmethylated cytosine residues into uracil via a sulfonation-deamination-desulfonation cascade. Covalently modified 5-methylcytosines (5mC) are completely resistant to this reaction and remain unchanged as cytosines.
- Dual-Channel qPCR Amplification:
- The converted DNA is amplified using primers specific for bisulfite-converted sequence.
- A FAM-labeled TaqMan MGB probe specifically hybridizes to the unmethylated sequence (bearing thymidines/uracils derived from unmethylated cytosines).
- A parallel reaction targets an invariant epigenetic marker—such as the unmethylated locus of GAPDH or CD3G (for total T cell normalization)—labeled with a VIC or HEX reporter dye.
3. The Validation Minefield: Overcoming Bisulfite Conversion & PCR Bias (CLSI MM17) #
Validating an epigenetic qPCR assay under CLSI MM17-A (Validation and Verification of Multiplex Nucleic Acid Assays) and ISO 15189 requires overcoming three unique chemical vulnerabilities:
A. Incomplete Bisulfite Conversion Invalidation #
If the sodium bisulfite incubation fails to achieve ≥ 99.5% conversion efficiency, residual unmethylated cytosines fail to deaminate, behaving as "methylated" residues during thermal cycling.
- The Clinical Disaster: Incomplete conversion causes the qPCR assay to under-report the unmethylated TSDR allele, calculating an artificial 40% to 60% drop in Treg frequencies in patient samples.
- The Bench SOP Fix: Every reaction plate must incorporate an internal synthetic non-human DNA conversion control (e.g., universal unmethylated lambda phage DNA). Amplification curves from conversion-sensitive primers must verify that unconverted cytosine background remains below 0.2% before any patient data can be legally released.
B. PCR Amplification Bias Toward GC-Rich Alleles #
Bisulfite-converted unmethylated DNA is converted into an extremely AT-rich strand (where nearly all non-CpG cytosines become uracils), dropping the duplex melting temperature (Tm) by up to 12°C. Conversely, methylated strands retain their GC content.
- Standard Taq polymerases exhibit severe amplification bias toward GC-rich methylated amplicons, generating unequal amplification efficiency (Emeth ne Eunmeth).
- The Bench SOP Fix: Primers must be chemically engineered without any CpG dinucleotides within their core priming sequences, ensuring identical annealing kinetics across both methylated and unmethylated templates with slope efficiencies strictly validated between -3.20 and -3.50 (92% - 105%).
4. Comprehensive Technology Matrix: Epigenetic qPCR vs. Flow Cytometry vs. CyTOF #
The following analytical comparison matrix details performance parameters across modern clinical immune cell profiling methodologies:
| Performance Attribute | Epiontis ID (Epigenetic qPCR) | 12-Color Clinical Flow Cytometry | Mass Cytometry (CyTOF) | Single-Cell RNA-seq (scRNA-seq) |
|---|---|---|---|---|
| Sample Material Required | Frozen Whole Blood / Dried Blood Spots (DBS) | Fresh Whole Blood / Viable PBMCs | Viable Single-Cell PBMC Suspension | Fresh Viable Single-Cell Suspensions |
| Minimum Sample Volume | 50,muL whole blood (or 2 DBS spots) | 2.0,mL - 5.0,mL fresh blood | 5.0,mL - 10.0,mL fresh blood | > 50,000 viable cells (> 90% viability) |
| Pre-Analytical Window | > 5 Years at -80°C (Stable indefinite) | Strict < 24 - 48 Hours ambient | Strict < 24 - 48 Hours | Strict < 2 - 4 Hours post-isolation |
| Inter-Operator Gating Variance | 0.0% CV (Pure mathematical Ct curve) | 14.0% - 25.0% CV (Subjective gates) | 15.0% - 30.0% CV (Clustering drift) | Algorithmic clustering dependent |
| Cell Loss via Wash/Ficoll | 0.0% (Direct lysis of whole matrix) | 20% - 40% PBMC preparation loss | 35% - 50% PBMC recovery loss | Extensive fluidic sorting loss |
| Target Cell Resolution | Strict lineage-specific (TSDR nTreg, CD4, CD8, NK) | Phenotypic surface continuum | Highly multiplexed (> 40 markers) | Whole transcriptome expression |
| Clinical Trial Multi-Center Logistics | Ship on dry ice or ambient DBS envelopes | Highly complex temperature-controlled courier | Highly complex specialized couriers | Requires on-site clinical lab integration |
| Regulatory Validation Status | CLSI MM17 / CAP / CLIA Validated | CLSI H62 / IVDR Certified | High-complexity LDT only | Research Use Only (RUO) |
5. Step-by-Step Validation & Qualification SOP for Clinical Biomarker Desks #
To qualify an epigenetic immune cell quantification protocol for regulatory drug submission (GCP/GCLP compliance), laboratories must execute the following five analytical qualification stages:
  [1. ANALYTICAL SPECIFICITY] ──► [2. LINEARITY & LOD/LOQ] ──► [3. INTER-LAB REPRODUCIBILITY]
   Zero cross-reactivity with      Range: 0.1% to 25.0% Treg     Inter-operator CV < 6.5%
   activated Tconv cells           LOQ: ≤ 15 copies/reaction     Across 3 distinct sites
Stage 1: Linearity and Measuring Range #
- Prepare synthetic calibration mixtures by titrating fully unmethylated Jurkat DNA (enzymatically treated with whole-genome amplification) into 100% methylated primary human donor DNA (treated with SssI methyltransferase).
- Construct a 7-point dilution curve spanning 0.10% to 30.0% demethylated target sequence.
- Acceptance Criteria: The linear regression must achieve an R2 ≥ 0.992, with recovery across all measuring levels falling between 85.0% and 115.0%.
Stage 2: Limit of Blank (LOB) and Limit of Quantitation (LOQ) #
- Run 60 replicates of 100% methylated blank matrix across three separate days.
- Determine LOB = mublank + 1.645 × sigmablank.
- The Limit of Quantitation (LOQ)—defined as the lowest concentration demonstrating CV < 15.0%—must reliably detect ≤ 15 unmethylated cell equivalents per PCR reaction.
Stage 3: Repeatability and Intermediate Precision #
- Evaluate low (1.5%), medium (5.5%), and high (18.0%) Treg clinical whole blood controls across 20 operating days, with two independent operators and two distinct real-time PCR platforms (e.g., QuantStudio 7 Pro and Bio-Rad CFX384).
- Acceptance Criteria: Within-run repeatability must achieve CV < 5.0%, and total intermediate precision across all 20 days must remain < 8.5% CV.
Stage 4: Matrix Equivalency Testing (Liquid EDTA vs. Heparin vs. Dried Blood Spot) #
- In clinical trials, clinical sites routinely draw blood into disparate tube chemistries. Validate that blood collected in K2-EDTA, Cyto-Chex BCT, and Whatman 903 protein saver cards yields identical calculated cell frequencies (R2 > 0.985, slope 0.95 - 1.05).
- Crucial Bench Warning: Heparin collection tubes are strictly forbidden. Residual lithium/sodium heparin co-purifies with genomic DNA and irreversibly inhibits Taq polymerase at concentrations as low as 0.002,U/muL.
6. Regulatory Documentation & Clinical Trial Protocol Integration #
When incorporating Epiontis ID epigenetic biomarker endpoints into an FDA IND or EMA Clinical Trial Application (CTA), sponsors must provide unambiguous qualification documentation:
- Pre-Analytical Stability Validation: Provide accelerated and real-time stability testing establishing sample integrity. Validated protocols demonstrate that dried blood spots stored at ambient room temperature in desiccated pouches remain epigenetically stable for > 180 days, and frozen whole blood remains stable at -80°C for over five years.
- Algorithm Transparency: Define the mathematical normalization equations in the clinical study protocol. When reporting absolute immune cell counts per microliter of blood, integrate hemoglobin or total genomic leukocyte normalization formulas to account for patient hematocrit variance.
- Blinded Proficiency Testing: Participate in external quality assessment (EQA) proficiency rounds comparing epigenetic cell quantification against reference clinical flow cytometry centers, ensuring continuous cross-platform harmonization.
By transitioning from fragile surface-antigen flow cytometry to robust, permanent epigenetic DNA methylation metrics, clinical researchers transform unstable biological samples into permanent, audit-proof quantitative endpoints.
Expert Technical & Engineering FAQs
1How does Epiontis ID distinguish true Regulatory T cells (Tregs) from activated conventional T cells?▾
2Can Epiontis epigenetic assays be performed on frozen blood or dried blood spots?▾
3What is the minimum bisulfite conversion efficiency required for a valid Epiontis assay?▾
4Why are heparin blood collection tubes prohibited in epigenetic qPCR workflows?▾
5How do you calculate absolute cell counts (cells/µL) from epigenetic qPCR data?▾
BioScienceDesk Editorial & Research Desk
Verified Institutional PublicationA Jayanti Cybernetics Life Sciences Media Division
Our technical guides, comparative benchmarks, and protocol troubleshooting analyses are synthesized by our editorial research desk under the governance of our Scientific Advisory Board.
Are you an R&D Scientist, Application Specialist, or Lab Director?
Feature your technical article, research insight, or equipment review with full author byline & LinkedIn credit.
Related Insights in Immunology
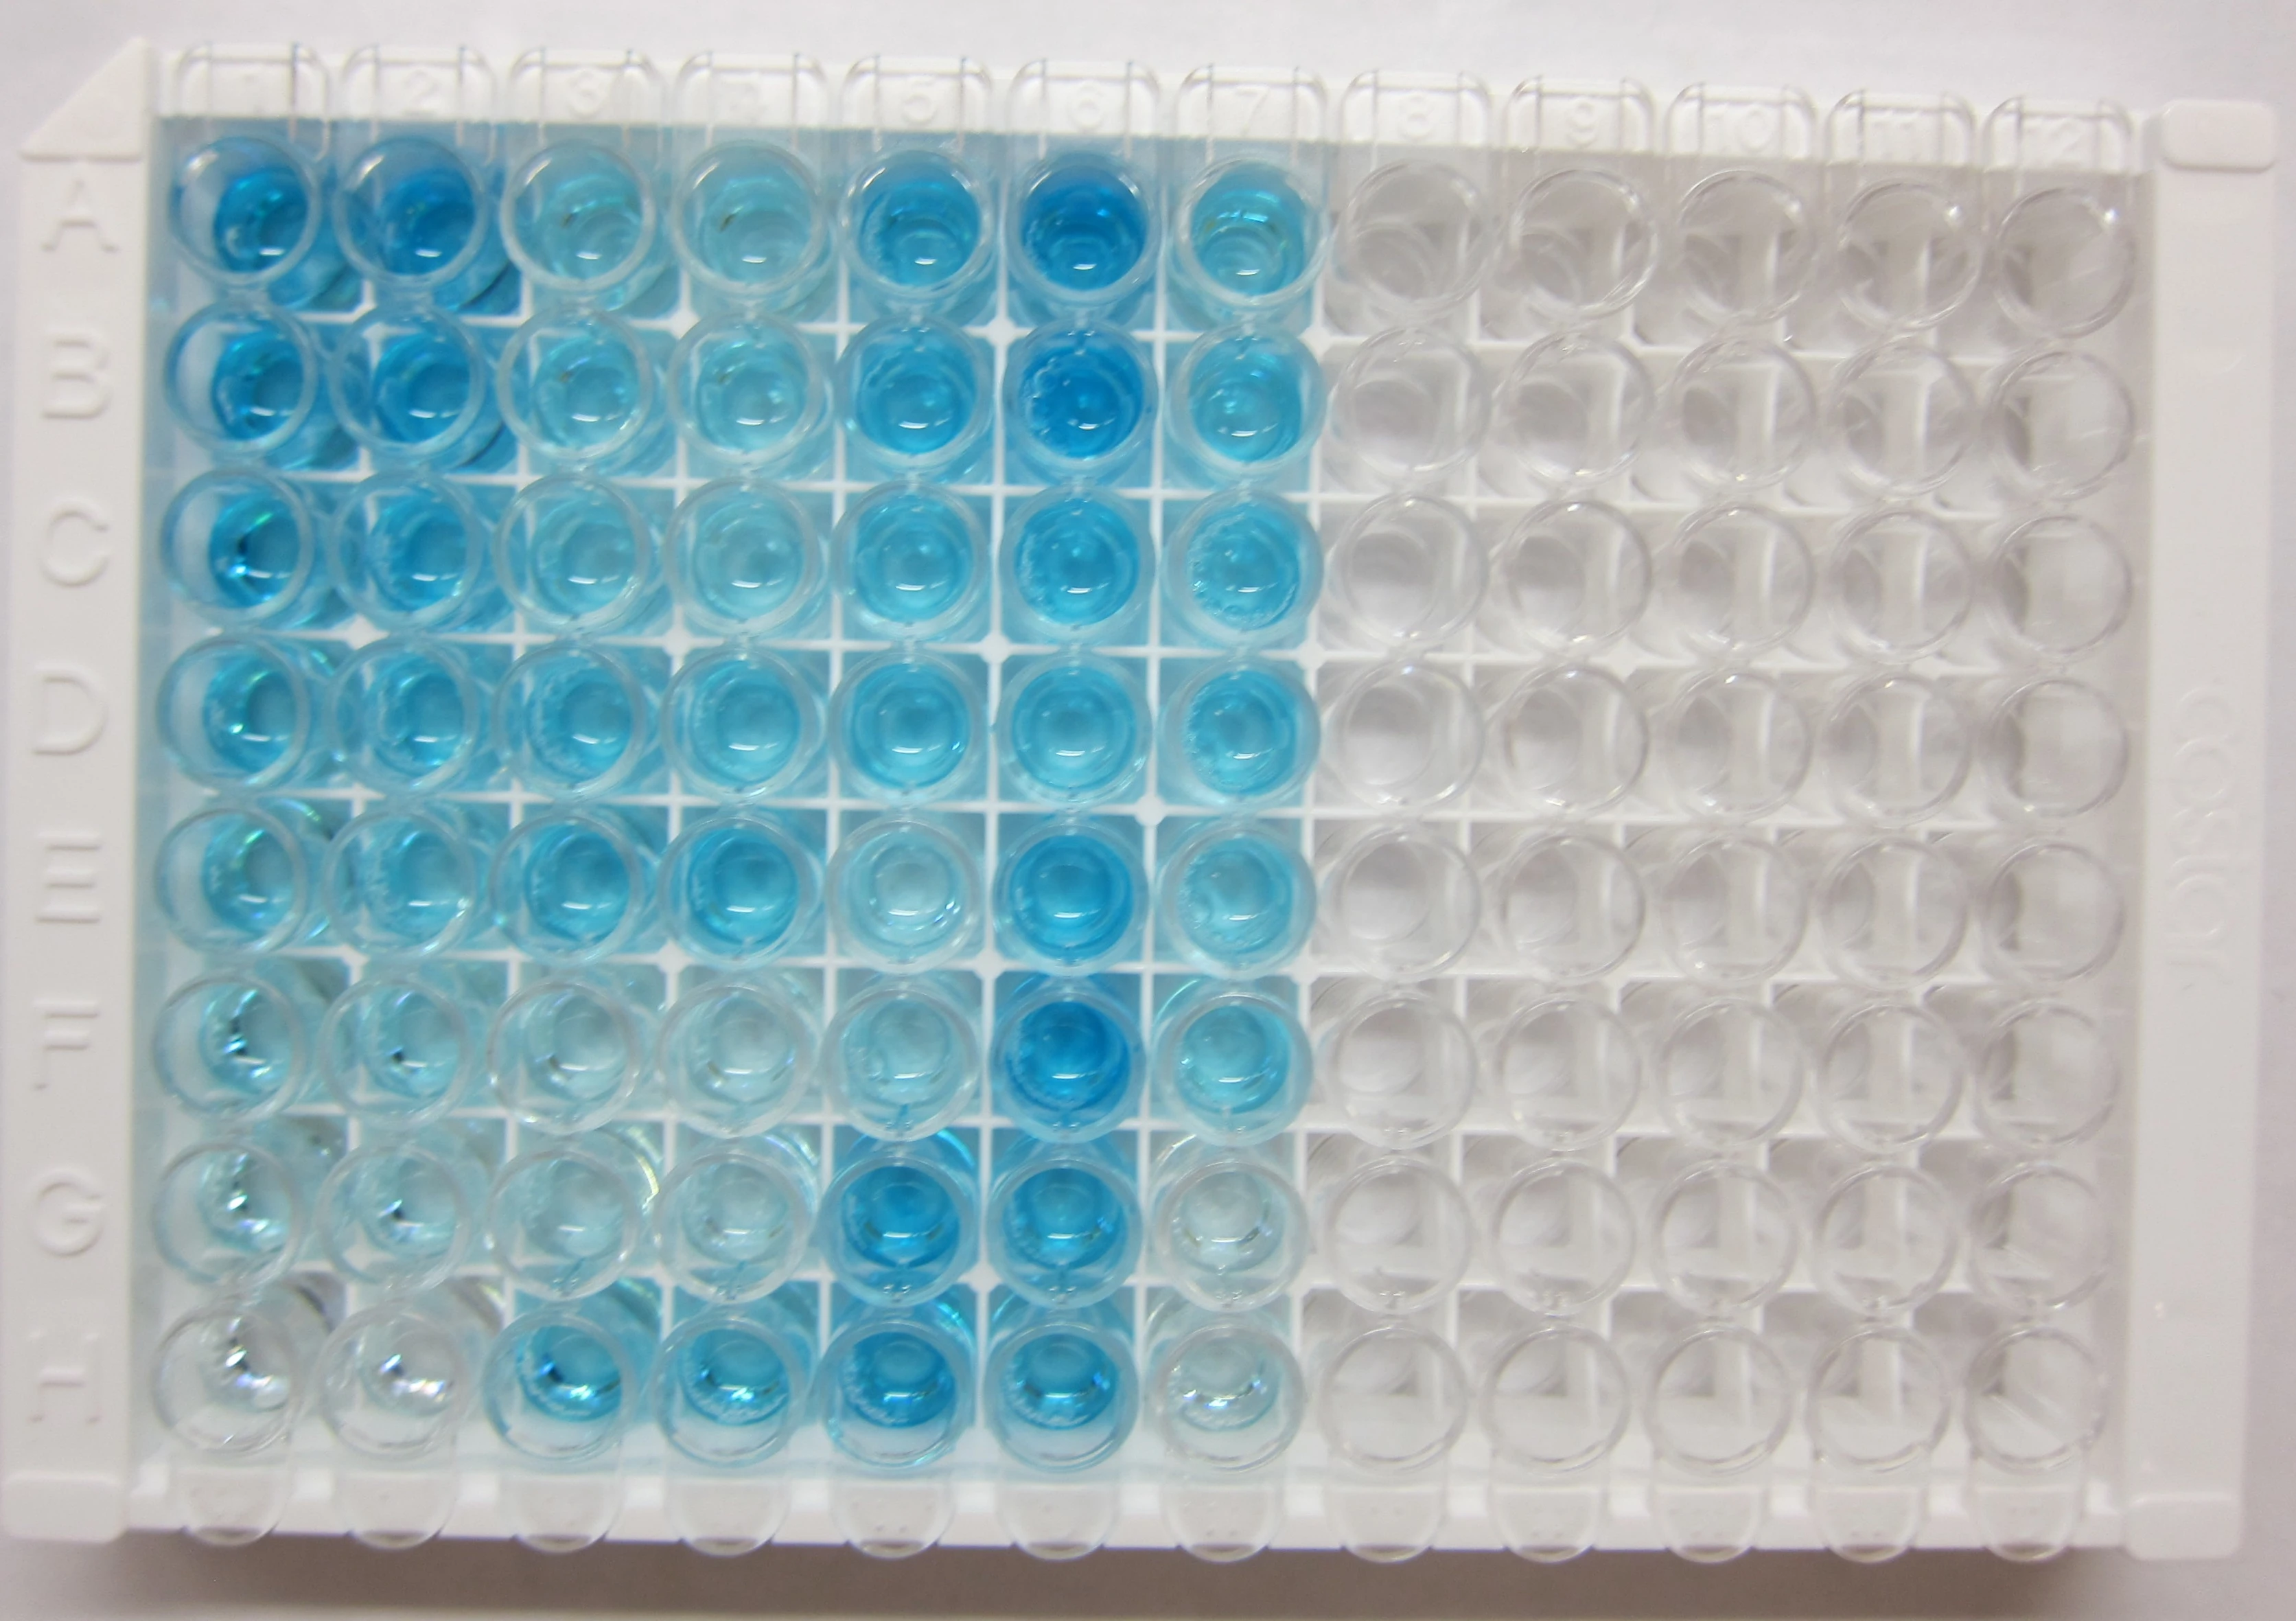
Eliminating Heterophilic Antibody and Rheumatoid Factor Interference in Sandwich ELISA
Nothing derails a clinical assay validation faster than healthy negative donor plasma reading OD 2.1. We show how HAMA and IgM rheumatoid factor bridge capture and detection IgGs—and the exact blocker concentrations that silence them.
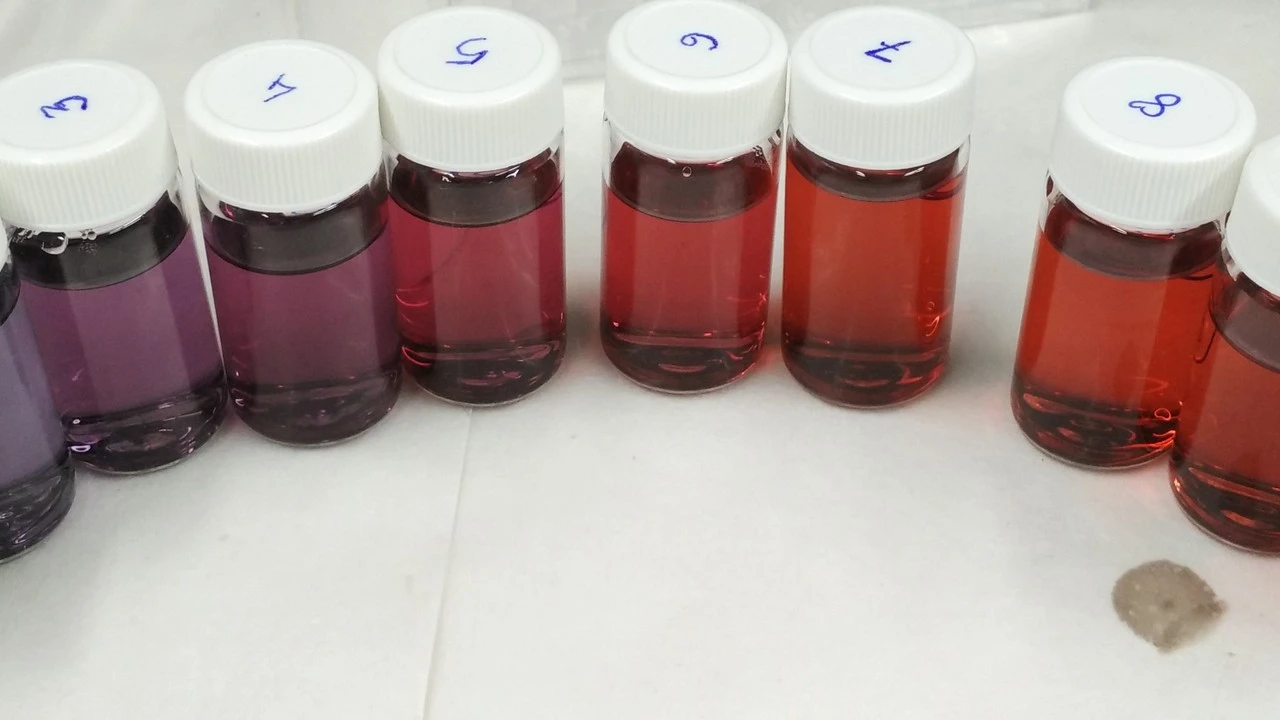
Why Carrier-Free Recombinant Antigens Drastically Improve Gold and Latex Conjugation
Trying to conjugate a BSA-stabilized antigen onto 40 nm colloidal gold or carboxyl latex beads is a guaranteed recipe for silent assay failure. Because BSA outnumbers your target protein 50-to-1, it steals every active binding site on the nanoparticle.
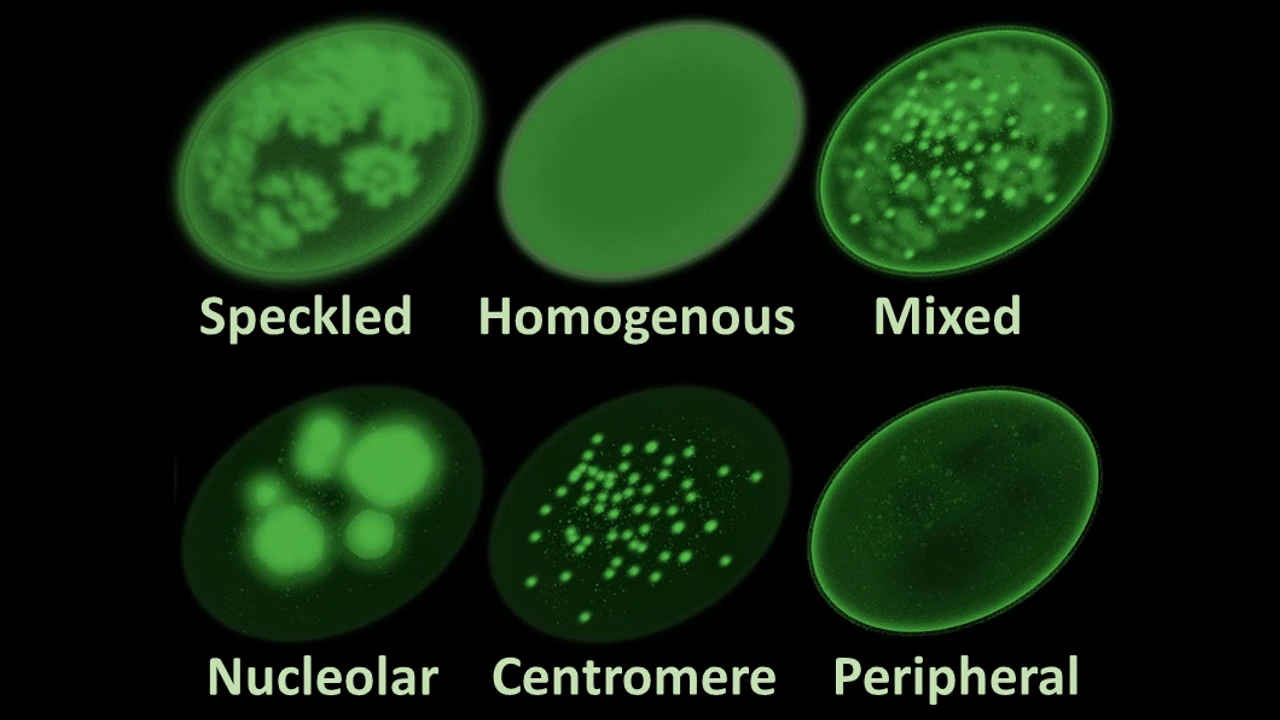
ANA Testing Methodologies: Comparing Indirect Immunofluorescence (IFA) vs. Multiplex Bead Assays
Solid-phase multiplex bead screens save laboratory labor, yet they still miss up to 18% of rare nucleolar and mitotic spindle autoantibodies. We examine why HEp-2 indirect immunofluorescence remains the clinical gold standard alongside automated titer readers.
Get Latest Life Science Insights & Guides in Your Inbox
Bi-weekly diagnostic articles, laboratory troubleshooting guides, and equipment reviews.